Data Visualization
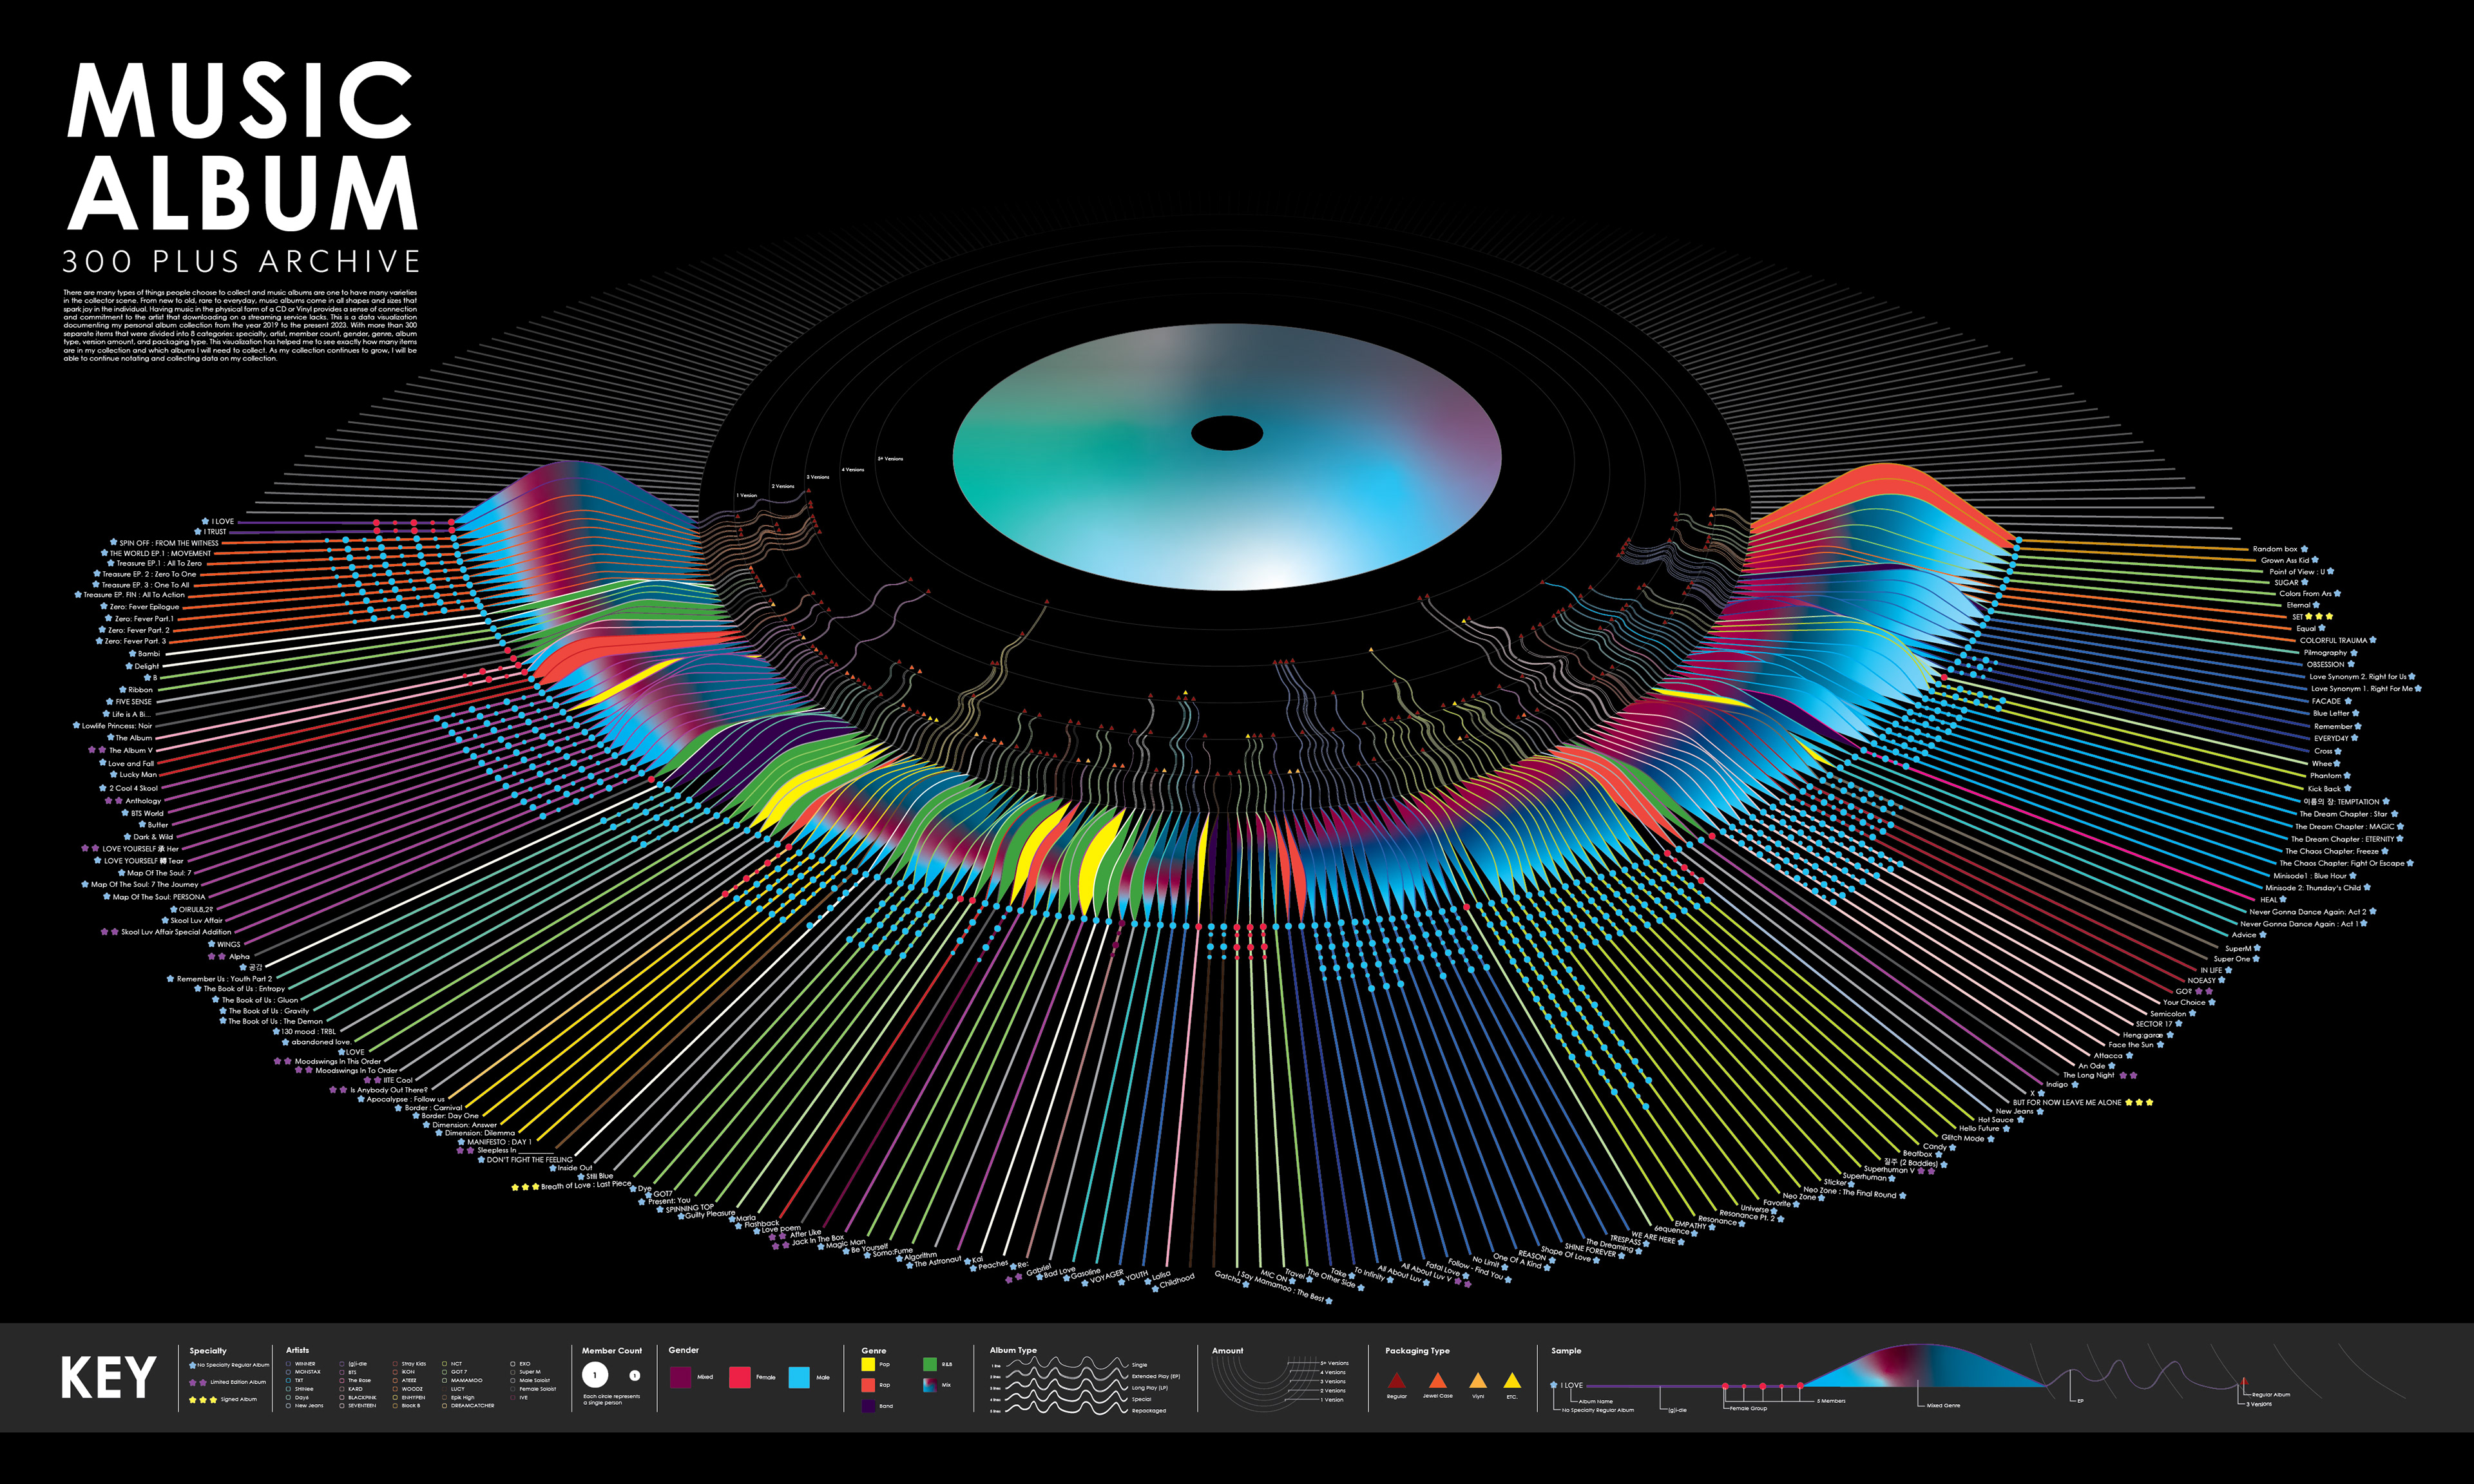
All the Albums I Own
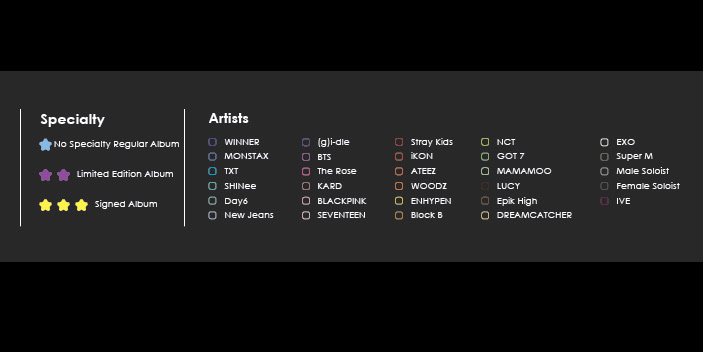
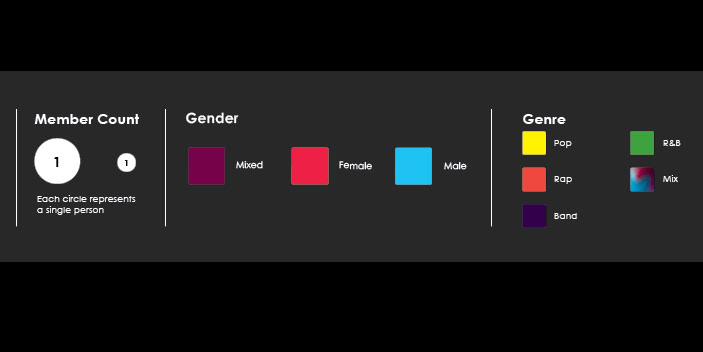
This visualization project tasked us with collecting a minimum of 100 items and using various methods of data organized into a singular poster. This is a data visualization documenting my personal album collection from the year 2019 to the present 2023, with more than 300 separate items that were divided into 8 categories: specialty, artist, member count, gender, genre, album type, version amount, and packaging type. The main imagery of the infographic is based on a CD, and the data is presented in a circular format, using the bottom half of the CD to present the available data. The Data is linear, reading from the end of each line to the circle's center. The various colors allow the user to differentiate each item visually.
TYPOGRAPHY | INFOGRAPHIC | POSTER DESIGN | ICONOGRAPHY